| Instrument: |
Dual-beam UV-Absorption Ozone Photometer |
| Principal Investigator: |
|
| Co-Investigator: |
|
|
Organization: |
Jet Propulsion Laboratory Mail Stop 183-601 4800 Oak Grove Drive Pasadena, CA 91109-8099 |
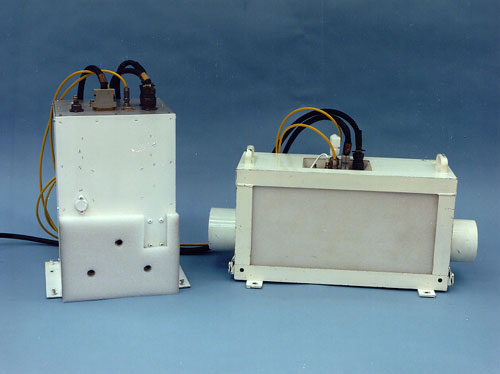
Measurement Description: The photometer’s, Figure 1, primary components are a mercury lamp, two identical sample chambers, two detectors, and a scrubber. The lamp provides 254 nm radiation that is transmitted through the length of the chambers to the detectors, one chamber containing the air sample with ozone and other containing air with the ozone removed. Ozone strongly absorbs this wavelength, allowing virtually continuous measurements of ozone by comparing the detected signals in the two chambers, and periodically alternating the roles of the two chambers [Proffitt and McLaughlin, 1983; Proffitt et al., 1989a]. The ozone number density in the chamber is calculated using the well known ozone absorption cross-section. Measurement of the chamber temperature and pressure allows for the calculation of the ozone mixing ratio which is invariant between the chamber and the atmosphere. With a one second data rate, the minimum detectable concentration of ozone (one standard deviation) is 1.5x10¹⁰ molecules/cm3 (0.6 ppbv at STP), approximately 1% of a typical stratospheric abundance.
|
Precision: |
1.5x10¹⁰ molecules/cm3 (0.6 ppbv at STP) |
|
Accuracy: |
3% + precision |
|
Response Time: |
1 second |
|
Weight: |
30 kg |
|
Power: |
5 W |
Accurate measurements of ozone are a prerequisite for quantifying our understanding of processes controlling ozone levels at mid- to high latitudes. Ozone is also an important chemically conserved molecular species for studying atmospheric dynamics since it has a clear stratospheric source. When referenced to measurements of other atmospheric tracer species, the highly accurate in situ ozone measurements can provide sufficient information to distinguish between dynamically and chemically induced changes in ozone [Proffitt et al., 1989b; Salawitch et al., 2002]. In the Southern Hemisphere, ozone loss outside the ozone hole, midwinter ozone loss, and tropical ozone production were identified by this method [Proffitt et al., 1989b]. Early winter ozone loss accompanied by dynamically induced ozone increases at higher altitudes were found in the Northern Hemisphere [Proffitt et al., 1990; Proffitt et al., 1993].
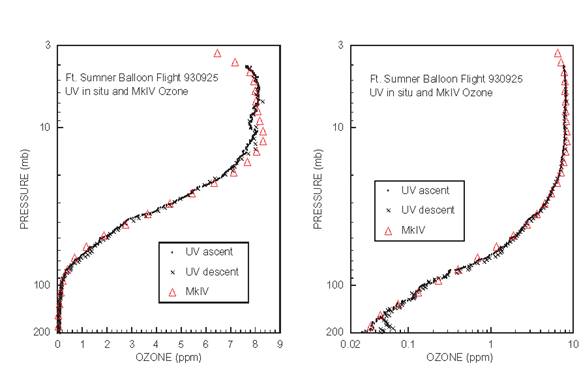
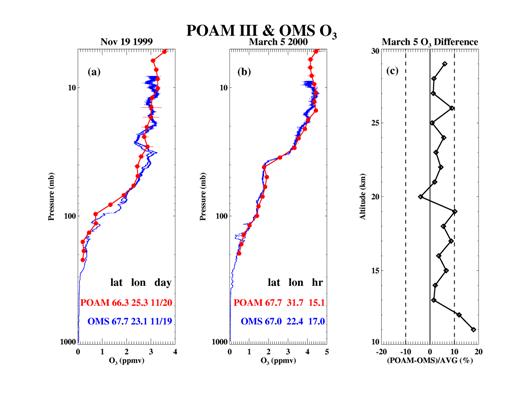
The highly accurate in situ ozone measurements provide correlative data needed to validate the remotely made measurements of this molecular species that is used to quantitatively assess mid- and high-latitude ozone loss. Figure 2 shows a comparison of the sunset profile of ozone measured by MkIV on 25 September, 1993, and ascent and descent profiles observed by the in situ UV-Absorption Ozone photometer on board the same gondola [Sen et at., 1998]. The two in situ measurements of ozone, obtained »20 hours apart and separated by 200 km, agree to better than 5%. Figure 3 shows the comparison between POAM III and JPL in situ ozone data for two flights of the UV-Absorption Photometer [Lumpe et al., 2003]. In both cases the agreement is excellent, and rivals that seen for in situ-remote comparisons of the instruments flying on the same balloon gondola [Sen et al., 1998]. The ability of POAM to discern the very steep falloff in ozone near 30 mb on March 5, 2000, is especially noteworthy and demonstrates the capability of the satellite to resolve sharp vertical structures.
References:
Proffitt, M.H. and R.J. McLaughlin, Fast response dual bean UV absorption ozone photometer suitable for use on stratospheric balloons, Rev. Sci. Instrum., 54(12), 1719–1728, 1983.
Proffitt, M.H., M.J. Steinkamp, J.A. Powell, R.J. McLaughlin, O.A. Mills, A.L. Schmeltekopf, T.L. Thompson, A.F. Tuck, T. Tyler, R.H. Winkler, and K.R. Chan, In situ ozone measurements within the 1987 Antarctic ozone hole from a high-altitude ER-2 aircraft, J. Geophys. Res., 94(D14), 16547–16555, doi:10.1029/89JD00905, 1989a.
Proffitt, M.H., D.W.Fahey, K.K. Kelly, and A.F. Tuck, High-latitude ozone loss outside the Antarctic ozone hole, Nature, 342(6247), 233–237, 1989b.
Salawitch, R.J., J.J. Margitan, B. Sen, G.C. Toon, M. Rex, G.B. Osterman, J.W. Elkins, E.A. Ray, F.L. Moore, E. Richard, P. Romashkin, D. Hurst, and W. Brune, Chemical loss of ozone during the Arctic winter of 1999–2000: an analysis based on balloon-borne observations, J. Geophys. Res., 107(D20), 8269–8288, doi:10.1029/2001JD000620, 2002.
Proffitt, M.H., J.J. Margitan, K.K. Kelly, M. Loewenstein, J.R. Podolske, and K.R. Chan, Ozone loss in the Arctic polar vortex inferred from high-altitude aircraft measurements, Nature, 347(6288), 31–36, 1990.
Proffitt, M.H., K. Aikin, J.J. Margitan, M. Loewenstein, J.R. Podolske, A. Weaver, K.R. Chan, H. Fast, and J.W Elkins, Ozone loss inside the northern polar vortex during the 1991–1992 winter, Science, 261(5152), 1150–1154, 1993.
Sen, B., G.C. Toon, G.B. Osterman, J.-F. Blavier, J.J. Margitan, R.J. Salawitch, and G.K. Yue, Measurements of reactive nitrogen in the stratosphere, J. Geophys. Res., 103(D3), 3571–3585, doi:10.1029/97JD02468, 1998.
Lumpe, J.D, M. Fromm, K. Hoppel, R. Bevilacquea, C.E. Randall, E.V. Browell, W.B. Grant, T. McGee, J. Burris, L. Twigg, E.C. Richard, G.C. Toon, J.J. Margita, B. Sen, K. Pfeilsticker, H. Boesch, R. Fitzenberger, F. Goutail, and J.-P. Pommereau, Comparison of POAM III ozone measurements with correlative aircraft and balloon data during SOLVE, J. Geophys. Res., 108(D5), 8316–8336, doi:10.1029/2001JD000472, 2003.
UV Ozone Balloon Flights (as of 22 Sep 2007)
|
Date |
Site |
Latitude |
Longitude |
Campaign |
| 13 Sep 1988 | Palestine, Texas | 31.8 W |
95.7 W | |
| 27 May 1989 | Palestine, Texas | 31.8 W |
95.7 W | |
| 29 Aug 1989 | Palestine, Texas | 31.8 W |
95.7 W | |
| 08 Oct 1989 | Ft. Sumner, New Mexico | 34.5 N |
104.2 W | |
| 12 May 1990 | Ft. Sumner, New Mexico | 34.5 N |
104.2 W | |
| 04 Jun 1990 | Ft. Sumner, New Mexico | 34.5 N |
104.2 W | |
| 27 Sep 1990 | Ft. Sumner, New Mexico | 34.5 N |
104.2 W | |
| 09 Apr 1991 | Dagett, California | 34.9 N |
116.8 W | UARS |
| 01 Oct 1991 | Ft. Sumner, New Mexico | 34.5 N |
104.2 W | UARS |
| 20 Feb 1992 | Dagett, California | 34.9 N |
116.8 W | UARS |
| 29 May 1992 | Ft. Sumner, New Mexico | 34.5 N |
104.2 W | UARS |
| 29 Sep 1992 | Ft. Sumner, New Mexico | 34.5 N |
104.2 W | UARS |
| 03 Apr 1993 | Dagett, California | 34.9 N |
116.8 W | UARS |
| 31 May 1993 | Ft. Sumner, New Mexico | 34.5 N |
104.2 W | UARS |
| 25 Sep 1993 | Ft. Sumner, New Mexico | 34.5 N |
104.2 W | UARS |
| 09 Feb 1994 | Esrange, Sweden | 67.9 N |
21.1 E | UARS |
| 22 May 1994 | Ft. Sumner, New Mexico | 34.5 N |
104.2 W | UARS |
| 09 Oct 1994 | Ft. Sumner, New Mexico | 34.5 N |
104.2 W | UARS |
| 03 Feb 1995 | Esrange, Sweden | 67.9 N |
21.1 E | UARS |
| 10 Jun 1996 | Ft. Sumner, New Mexico | 34.5 N |
104.2 W | OMS |
| 21 Sep 1996 | Ft. Sumner, New Mexico | 34.5 N |
104.2 W | OMS |
| 14 Feb 1997 | Juazeiro do Norte, Brazil | 39.3 W |
7.2 S | |
| 30 Apr 1997 | Fairbanks, Alaska | 64.8 N |
147.6 W | |
| 30 Jun 1997 | Fairbanks, Alaska | 64.8 N |
147.6 W | |
| 08 Jul 1997 | Fairbanks, Alaska | 64.8 N |
147.6 W | |
| 11 Nov 1997 | Juazeiro do Norte, Brazil | 39.3 W |
7.2 S | |
| 20 Nov 1997 | Juazeiro do Norte, Brazil | 39.3 W |
7.2 S | |
| 18 May 1998 | Ft. Sumner, New Mexico | 34.5 N |
104.2 W | |
| 19 Nov 1999 | Esrange, Sweden | 67.9 N |
21.1 E | |
| 05 Mar 2000 | Esrange, Sweden | 67.9 N |
21.1 E | |
| 13 Oct 2002 | Ft. Sumner, New Mexico | 34.5 N |
104.2 W | |
| 16 Dec 2002 | Esrange, Sweden | 67.9 N |
21.1 E | |
| 31 Mar 2003 | Esrange, Sweden | 67.9 N |
21.1 E | |
| 16 Sep 2003 | Ft. Sumner, New Mexico | 34.5 N |
104.2 W | |
| 19 Sep 2003 | Ft. Sumner, New Mexico | 34.5 N |
104.2 W | BOS |
| 17 Sep 2004 | Ft. Sumner, New Mexico | 34.5 N |
104.2 W | |
| 01 Mar 2005 | Esrange, Sweden | 67.9 N |
21.1 E | AVE |
| 20 Sep 2005 | Ft. Sumner, New Mexico | 34.5 N |
104.2 W | |
| 01 Oct 2005 | Ft. Sumner, New Mexico | 34.5 N | 104.2 W | |
| 24 Jan 2007 | Esrange, Sweden | 67.9 N | 21.1 E | |
| 22 Sep 2007 | Ft. Sumner, New Mexico | 34.5 N | 104.2 W |
| ADEOS: | Advanced Earth Observing Satellite |
| AVE: | AURA Validation Experiment |
| BOS: | Balloon Observations of the Stratosphere |
| CWAS: | Cryogenic Whole Air Sampler |
| OMS: | Observations of the Middle Stratosphere |
| POLARIS: | Photochemistry of Ozone Loss in the Arctic Region in Summer |
| SOLVE: | SAGE III Ozone Loss and Validation Experiment |
| UARS: | Upper Atmosphere Research Satellite |
|
Figure 1. JPL UV Ozone Electronics and Photometer.
|
Figure 2. JPL UV Ozone and MkIV inter comparison.
|
Figure 3. JPL UV Ozone and POAM III inter comparison.